MEASURING AND MONITORING CARBON EMISSION TO PROMOTE LOW-CARBON DEVELOPMENT IN JOHOR BAHRU
by Isiaka Adeyemi Abdul-Azeez
Department of Urban & Regional Planning,
Modibbo Adama University of Technology, Yola, Nigeria
Abstract
Reducing carbon dioxide emissions through low carbon development is an appropriate approach to combating climate change. The aim of this research is to identify ways of reducing carbon dioxide emissions in Johor Bahru—the capital city of the state of Johor, Malaysia, and the second-largest city in that country—and promoting low-carbon development. Because the practice of low-carbon development in Johor Bahru is relatively new and few projects have been completed to date, the focus in this work has been on refining the concept of low carbon, rather than the direct measurement of carbon dioxide (CO2) emissions. Because the majority of the carbon emissions in the region under study come from the electricity and transportation sectors, the Malaysian University Carbon Emission Tool (MUCET), described herein, was modified to measure and monitor emissions from Johor Bahru’s energy sector. That tool facilitated the formulation of policies that will target emission reduction, and thereby promote steady movement toward a clean energy future.
Introduction
Concentrations of human activities in today’s cities produce greenhouse gas emissions, which collectively account for about 78 percent of carbon emissions [1][2]. Those cities have an almost insatiable appetite for energy, both to conduct business as usual, and to grow. That appetite is met mainly through the combustion of fossil fuels, which causes carbon dioxide emissions, which in turn are the major driving force for climate change [4]. Many current technological practices favor the use of fossil fuels as their prime sources of energy [3], and therefore are major (if indirect) contributors to carbon emission.
Climate change is one of the greatest challenges to global development, posing a threat to both the environment and the world’s human population [5]. The effects of climate change can best be countered through the adoption of low-carbon technology and the design of mitigation policies, usually referred to as “Low-Carbon Development.” Typically, this involves the implementation of energy sustainability policies, which in turn brings about changes to the industrial structure, energy mix [6], and employment structures [7]. As nations around the globe chart a path to combating climate change, many cities have embraced the development objective of becoming low-carbon cities.
Low-carbon development is very significant to the sustainable development of cities. Over half of the global population resides in cities—a figure that is expected to rise to about 70 percent by 2050 (WRI). Cities are currently responsible for 67-76 percent of energy use and 71-76 percent of energy-related carbon dioxide emissions [4][8]. Sustainable development in the future, clearly, will depend upon cities finding ways to go low carbon [9].
Low-carbon development has its roots in the United Nations Forum for Climate Change Convention, adopted in Rio in 1992. That convention comprises strategies and growth plans that promote low-emission or climate-resilient economic growth [10]. Low-carbon development refers to a society that emits greenhouse gases (GHGs) only in an amount that can be absorbed by nature. By extension, it portends a movement towards a simpler lifestyle and a richer quality of life, in harmony with the natural world. This means encouraging the kinds of new growth, markets, and consumer attitudes that promote emission-reduction strategies and renewable energy use.
Against this backdrop, the Prime Minister of Malaysia pledged to reduce the carbon-emission intensity of Malaysia by 40 percent below its 2005 level by the year 2020 [13] [14]. To achieve this ambitious goal, the national government established agencies that were responsible for preparing the “blueprints” necessary for the promotion of a low-carbon society.
Notable among these plans is the Low Carbon Blueprint for Iskandar Malaysia 2025, which covers five local authorities including the entire district of Johor Bahru and Kulai Jaya. The blueprint recommends 281 strategic policies that would help achieve a target of 58 percent reduction in carbon intensity by 2025 compared to 2005 levels [15]. The document was officially embraced in 2012 by the Prime Minister of Malaysia and the Iskandar Regional Development Authority (IRDA).
Clearly, reducing carbon dioxide emissions to mitigate global warming and combat climate change will require an accurate assessment of the existing levels of CO2 emission, to serve as a baseline for going forward. The baseline emission for Johor Bahru was determined by the Low Carbon Asia Research Center, Universiti Teknologi Malaysia, UTM, in collaboration with a Japanese partner institution. This measurement and monitoring of carbon emissions was carried out for IRDA using the Asia‐Pacific Integrated Model (AIM) [16].
Self-monitoring is very important for administrators—both to understand the realities of the carbon situation, and to make informed decisions locally. IRDA is a case in point. It needs to be able to monitor emission reduction through its own interface—not only because planning for emission reductions becomes easier when familiar variables are considered, but also because people tend to adapt more easily when they understand how their “footprint” was determined.
As noted, energy has been identified as a key driver of CO2 emissions [17] [18]. Promoting low-carbon development in Johor Bahru will involve mapping carbon emissions from energy use, and then formulating policies based on that information.
The purpose of this research, therefore, is to study how low-carbon development is practiced in Johor Bahru, and describe a method of “carbon inventorying” to determine CO2 emissions resulting from energy use, in a manner that is easy for all stakeholders to understand. In theory, this will facilitate the setting and realization of emission reduction targets, and promote low-carbon development in Johor Bahru.
Background study
Cities are engines of growth of many nations. Economic growth requires the use of energy for movement, lighting, manufacturing, and a host of other purposes. But a thriving economy often comes at the expense of significant environmental impacts. Economic development generally translates into more energy consumption, which in turn leads to rising greenhouse gas emissions.
Because cities are among the largest contributors of carbon emission, they can play an important role in the development of a low-carbon economy [19]. Stated differently, because cities are where efforts aimed at poverty reduction and economic development tend to be focused, they are also where low-carbon innovations and emission reduction strategies are likely to be most compelling and productive [20].
Two kinds of energy tend to be essential for growth and development: liquid energy, for transport; and generated energy, for electricity. In both cases, the energy needed is predominantly derived from fossil fuels—such as coal, diesel, and petrol, among others—the combustion of which results in carbon dioxide (CO2). Energy-related emissions of CO2 and other greenhouse gases increased rapidly throughout the last century [21]. Aside from lighting, cooling, and heating buildings—which account for about 48 percent of all energy use in in the developed countries—transportation is the fastest-growing form of energy use, accounting for about 30 percent of the world‘s energy use and 95 percent of global oil consumption [22]. Under normal circumstances, therefore, economic growth and sustainable low-carbon development would appear to be in conflict. But by taking the low-carbon development path, cities can maintain desired growth rates, sustain living standards, and still control their fossil fuel-based energy consumption to minimize their carbon emissions. Planning ways to meet this ambitious set of goals therefore becomes imperative. The focus, again, should be to achieve energy transformation in a way that balances economic growth and the environment.
That planning begins with science. Measuring and reducing carbon emissions require rigorous scientific analysis, focused on the sources of those emissions, and how they can be reduced. A key first step, therefore, is the introduction of a technique for inventorying CO2 that is understood by the relevant administrators, and—ultimately—can facilitate the setting of realistic carbon emission reduction targets.
Low-carbon development: the Malaysian experience
The 10th Malaysian Plan clearly expressed the aspiration of improving environmental quality by undertaking climate change mitigation, while the sixth strategic thrust of the 11th Malaysian Plan 2016-2020 emphasized the pursuit of green growth for sustainability and resilience. It focused on four major areas:
- strengthening the enabling environment for green growth
- adopting the sustainable consumption and production concept
- conserving natural resources for present and future generations, and
- strengthening resilience in the face of climate change and natural disasters
The Malaysian government embraced low-carbon development to ensure that the energy used for development is consumed in an effective and efficient manner, without exacerbating climate change in the Iskandar Malaysia region in general, and Johor Bahru in particular. The government entrusted the Iskandar Regional Development Authority (IRDA) with the responsibility for pursuing green growth for sustainability and resilience in the region. IRDA—assisted by the Low-Carbon Asia Research Center UTM, Kyoto University, Japan and NIES, JICA, among others—developed the Low-Carbon Blueprint as a guide to achieve low-carbon development in the region, and show how it could benefit people socially, environmentally, and economically.
The blueprint was launched at COP 19 in 2012 [33] and provides the baseline for carbon emission in 2005 to understand the “Business as usual” (BAU) and counter-measure scenario. The blueprint has been adopted for the implementation of Low-Carbon Society at the five local authorities of Iskandar Malaysia, and IRDA is monitoring the implementation of the low-carbon projects by local authorities in Iskandar.
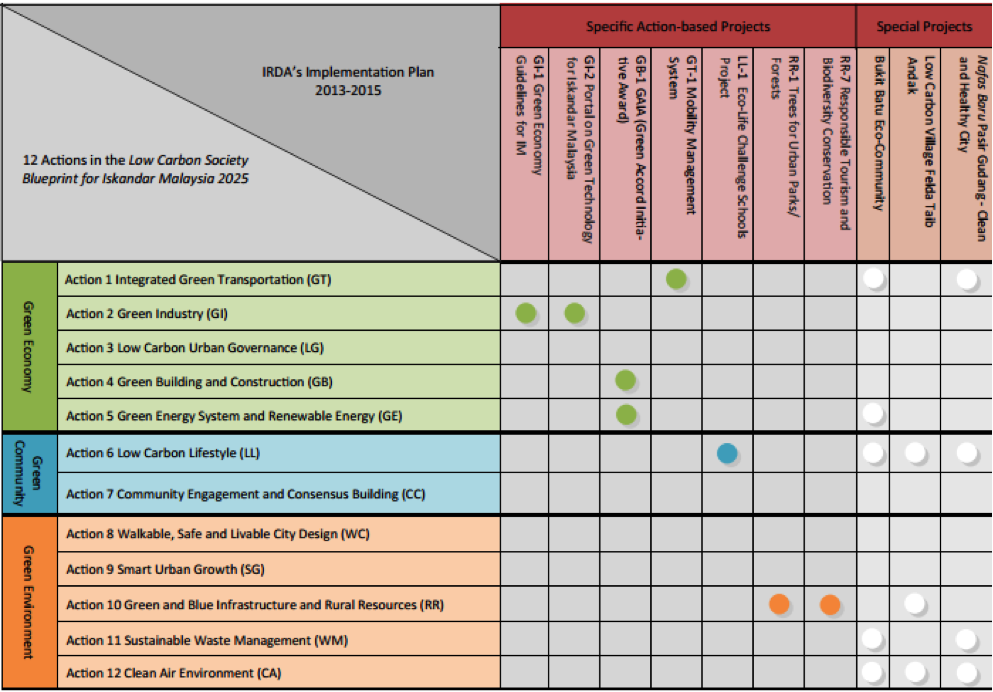
Figure 1 shows the matrix of key actions of the Low-Carbon Society Blueprint for Iskandar Malaysia 2025 in relation to IRDA’s Implementation Plans, 2013-2015. This roadmap includes seven out of the ten implementation Plans of IRDA. The implementation plans are IRDA’s initiatives towards a climate resilient economy in Iskandar Malaysia, prepared according to the recommendations of the Blueprint. The implementation plan covers the major themes of the Low Carbon Society concept: Green Economy, Green Community, and Green Environment. IRDA assists municipal authorities in determining how to implement low-carbon projects and programs through the preparation of local plans and organizing workshops, and also through conferences and publications aimed at creating awareness in the region.
Note that the roadmap did not examine three special projects (in the upper right-hand corner of Figure 1) that still required comprehensive study: Bukit Batu Eco-Community, Low Carbon Village Felda Taib Andak, and Nafas Baru Pasir Gudang. Nonetheless, especially in light of the relatively short amount of time elapsed, remarkable progress has been realized towards the low carbon development initiatives in Johor Bahru, and general awareness of the concept has been achieved.
Energy consumption in Johor Bahru
The effective production and consumption of energy is fundamental to achieving low carbon development. While the Malaysian Government seeks to promote economic growth and development in Johor Bahru—a major flagship in the Iskandar Malaysia region—it can’t encourage energy consumption that will increase the threat to global warming. Energy management therefore becomes critical, and the first step toward energy management is identifying the pattern of energy consumption in the city.
The extent of CO2 emissions depends in part of the types of industries that drive the local economy. The service sector, for example, is energy-intensive, as are industries that are heavily dependent on the movement of goods and services.
Figure 2 depicts energy consumption in Johor Bahru. Fossil fuels—in the form of oil, coal, and natural gas—are the primary source of energy. Again, generated energy (electricity) and liquid energy (transport) are the consumed products, from which data may be obtained to measure and compare the intensity of emission for various sectors of the city.
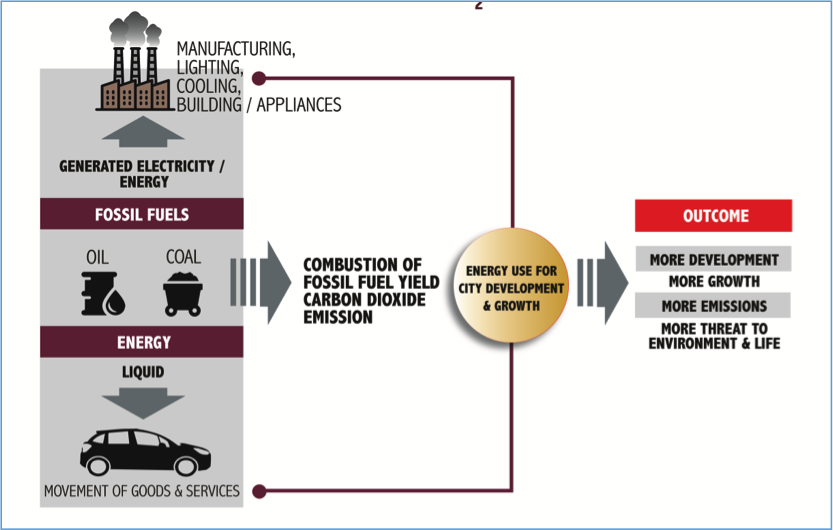
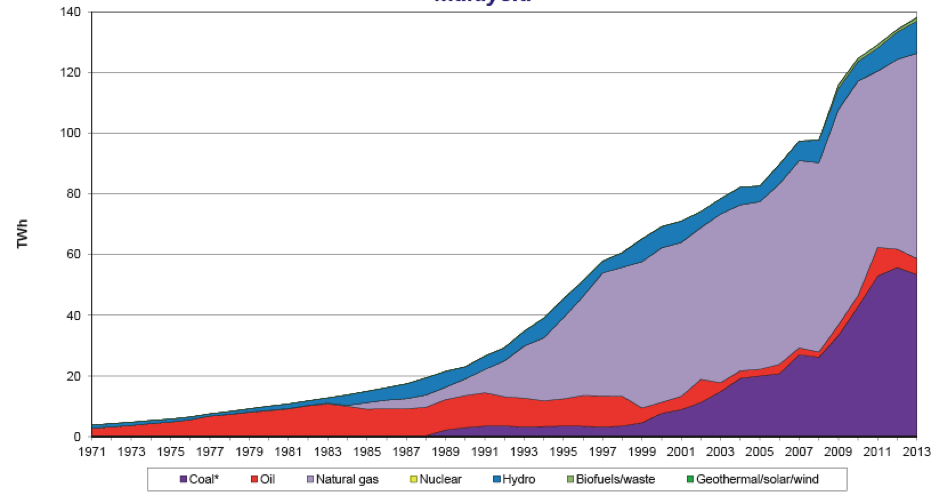
Figure 3 summarizes Malaysian electricity generation by fuel. Natural gas comprises the bulk of the fuel mix input, although coal and oil remain very significant. Based on this fuel mix, the emission factor for Malaysia is given as 0.741 Kg per Kwhr for year 2015 [34]. This figure is universal for electricity consumption in peninsular Malaysia, because electricity is generally purchased from a single source: Tenaga Nasional Berhad (TNB).
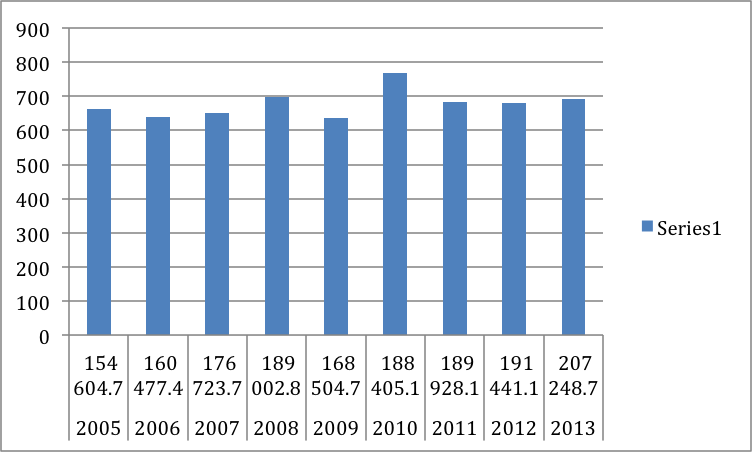
Table 1 shows carbon emissions from fuel combustion for electricity generation in Malaysia between years 2000 to 2013. Carbon emissions from the fuel mix consumed for Malaysian electricity have risen almost every year since 2000. The exception came in 2009, when the figure dropped 168,504.7 KtCO2 with an emission factor of 0.636 kg of CO2 per kWh from 189,002 in 2008 with an emission factor of 0.696 kg of CO2 per kWh (Figure 4). Carbon emissions picked up again in 2010 and rose to about 82 percent by 2013, with an emission factor of 0.693 kg of CO2 per kWh [35].
In light of the stated goal of the Malaysian government to go low carbon, one might expect adjusting the fuel mix of the country’s electricity production to emerge as a major focus for reducing the country’s emissions. The emission factor for electricity in Johor Bahru depends on the national figure as distributed by Tenaga Nasional Berhad (TNB): the largest electric utility company and the main energy provider in Malaysia. This factor is not steady, in fact, it has increased by 4 percent above the 2005 level (Table 1).

The load growth scenario for Johor Bahru is presented in Table 2. The consumption of electricity energy use is described according to service demand sectors, such as electricity use for domestic, industrial, commercial, and street lighting. Energy use by industry is the highes by far, followed by domestic and commercial uses respectively, while street lighting has the least consumption of electricity. Determining the extent of CO2 emissions from these sectors is a critical first step toward setting targets for emission reductions in Johor Bahru. But the transition to low carbon societies will not be complete without commitment and leadership from the Johor Bahru municipal authority, especially in promoting initiatives and measures to encourage energy efficiency, the use of alternative fuels, and the adoption of advanced and cleaner technologies, among many others measures.

Transport energy consumption in Johor Bahru
There are 21,401,269 vehicles registered in Malaysia. These include motorcycles, motorcars, buses, taxis, rental vehicles, goods vehicles, and excavators, among others. As of 2012, the capital territory of Kuala Lumpur (KL) had 4,963,646 vehicles, while Johor State had a vehicle population of 2,923,898, followed by Selangor with 2,363,333 vehicles.

Table 3 shows the types and number of registered vehicles in Johor Bahru. About 90 percent of the vehicles are private cars and motorcycles (47.2 percent and 43.8 percent, respectively). Lorries are about 4.9 percent, while public buses, taxis hired cars, and agricultural and heavy duty vehicles account for less than 1 percent each.
Since the majority of these vehicles use fossil fuel, the vehicular sector—particularly privately owned cars and motorcycles—is responsible for a high level of CO2 emissions . The study also shows that the public transport sector in Johor Bahru is not adequately developed. That fact both contributes to, and results from, high private vehicle ownership.
The Asia-Pacific Integrated Model Extended Snapshot Tool
The Asia–Pacific Integrated Modeling System (AIM) is an extended Snapshot Tool (ExSS) developed by Kyoto University and Japan’s National Institute for Environmental Studies (NIES) for the creation of low-carbon scenarios. The tool was used to account for greenhouse gas (GHG) emissions, upon which the GHG emission mitigation options of Iskandar Malaysia were based.
AIM is a static model that employs simultaneous equations involving some 6,000 variables to formulate its assumptions. These include economic growth and changes in industrial structure, demography, changes of lifestyles in terms of consumption pattern and energy service demand, transport volume and structure, and low-carbon measures that include energy-efficient devices and buildings, renewable energy, and modal shifts to public transport and fuel mix in power generation [39].
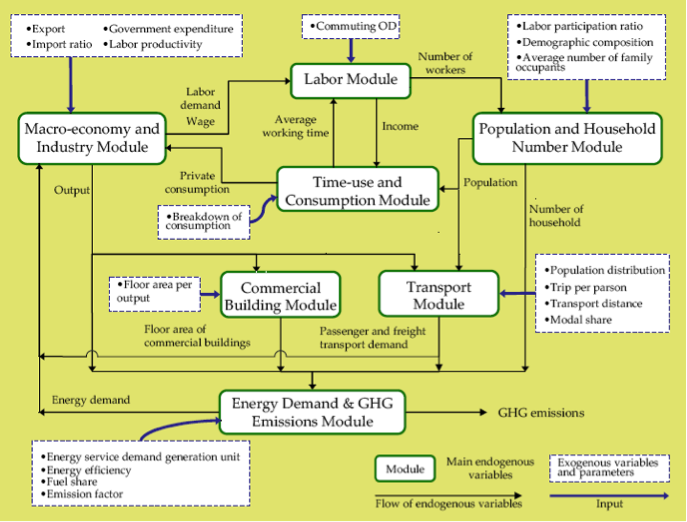
AIM also draws upon large multiple datasets that do not have a direct relationship to carbon dioxide emissions, and whose validation may be difficult. For instance, the program uses data for Population and Household; Input Output numbers (i.e., regional economic accounting); Transport demand (Passenger & Freight); Building Energy demand and Energy supply, to develop future scenarios such as population projection, economic projection or planning, transport planning, energy strategy (Figure 4).
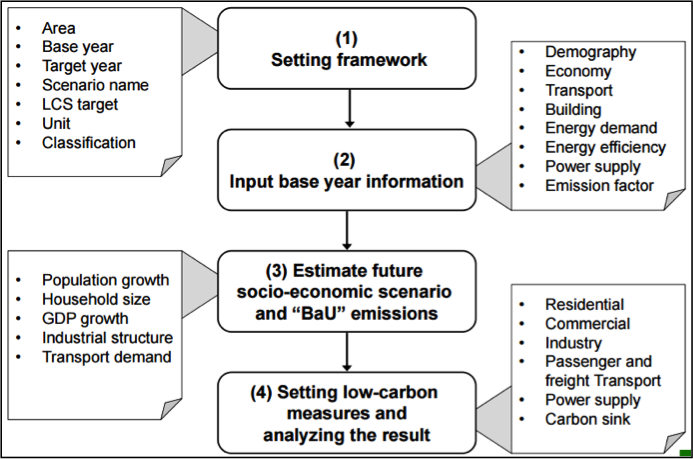
The AIM variables are quantified to create workable scenarios for a Low-Carbon Society, by “backcasting” from a set of desirable Low-Carbon Society goals and exploring possible options to achieve those goals. The tool can also be extended to model and describe scenarios in agriculture, forestry, land-use change, waste disposal, air and water pollution, and so on. Furthermore, the tool creates Business as Usual (BaU) and Counter Measure (CM) scenarios to determine the level of adjustment required to achieve the emission reduction goal, and can be used to make recommendations to the government for low-carbon development policies [40].
But the tool is far from perfect. AIM requires a great deal of data from many sectors that are not related to direct carbon emission reduction. In addition, the extent of carbon emission is simulated based on assumptions about energy consumption and other variables which, as a result of unforeseen inadequacies, may be subjective. Therefore, the tool may not be adequate for assisting in planning for low-carbon development in Johor Bahru. It is also difficult for policymakers to interpret the simulation results of the ExSS, due to the complexity of its design and the sheer volume of variables used for modeling (Figure 5).
The Low Carbon Cities Framework and Assessment System
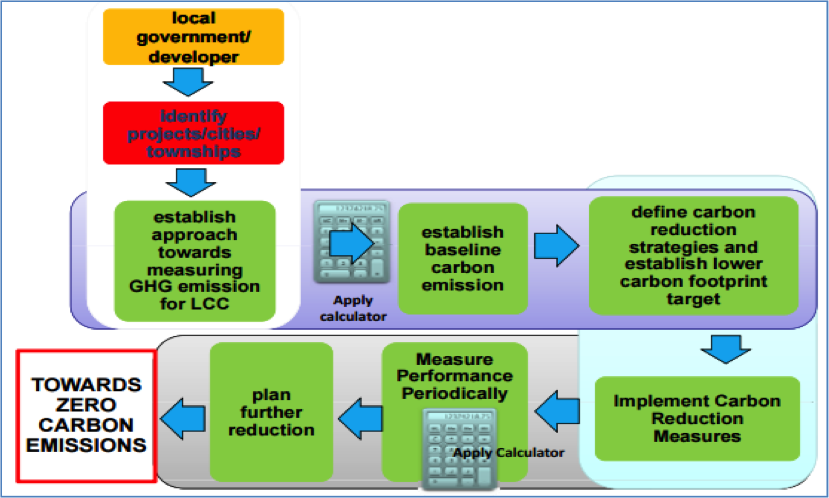
With AIM’s limitations in mind, let’s look at another tool that also has useful, if limited, applications. The Low Carbon Cities Framework and Assessment System (LCCF) is one of the existing carbon calculators used in Malaysia. The tool recognizes four relevant carbon factors contributing to GHG emission:
- Urban environment
- Urban transportation
- Urban infrastructure
- Buildings
Like AIM, LCCF considers many variables in the assessment of carbon emissions, such as 13 performance criteria and 35 sub-criteria. The process and procedure for application of LCCF is described in Figure 6.
Among the functions of LCCF are:
- encouraging and promoting the concept of low-carbon cities and townships in Malaysia
- guiding cities in making choice/decision towards greener solutions
- assisting stakeholders in developing action plans for low-carbon development and;
- calculating carbon emissions within a given development.
The Malaysian Ministry of Energy, Green Technology and Water (KeTTHA), in cooperation with the Japanese New Energy and Industrial Technology Development Organization (NEDO), used LCCF in Putrajaya and Cyberjaya as a showcase for other townships in Malaysia.
Although IRDA provided data for LCCF, the tool ultimately was considered to be overly complicated—in view of the large size of measurable variables required, and the lack of understanding of how the figures were derived—was not used in Johor Bahru. This decision may negatively affect the development and implementation of sound policies and practices regarding CO2 emissions reduction.
In view of the inadequacies of existing tools—both in terms of measuring actual CO2 emissions, and also in terms of lack of acceptance on the part of relevant administrators—another solution was needed.
The Malaysian University Carbon Emission Tool (MUCET)
This study adapted and adopted a prototype tool: the Malaysian University Carbon Emission Tool (MUCET), which was used in this case to chart the path for emission reduction in Johor Bahru. MUCET was developed by the researcher, and tested at UTM, Malaysia [18][41]. The tool focused mainly on energy and carbon emission related service sectors, arranged into two categories: generated electricity and transport fuel energy. The tool was designed based on the emission factors of the Malaysian peninsula’s electricity supply, as determined by the International Energy Agency (IEA), and also based on the fuel mix of electricity that was purchased from Tenaga Nasional Berhad (TNB). MUCET also integrated the emission factor for gasoline and diesel combustion in vehicles, in accordance with the Code of Federal Regulations at 40 CFR 600.113-78, based on Inter-Governmental Panel on Climate Change (IPCC) guidelines [42].
Figure 7 shows the adapted MUCET for Johor Bahru City Carbon Emission. Column A presents the service demand sectors for electricity and transport, while categories of energy use are shown in column B. The annual figures of petrol/gasoline and diesel consumed for traffic movement in litres, the electricity measured in kWh, and also natural gas consumption (where applicable) are entered into the calculator. The tool uses the conversion formula embedded in each column to generate the carbon emission equivalent. It also automatically converts the total annual electricity input for these sectors in kWhr into tons of carbon dioxide (tCO2).
The tool consists of rows of input variables, which are based on the two (2) service sectors i.e. Electricity and Transport. Similarly, the rows can be increased according to the category of uses and measured parameters.
The calculation of emission from fuel consumption of vehicles is based on the total amount of fuel recorded in litres, where the conversion rates of the inputs are embedded within the rows of the tool, so that the corresponding value of carbon emission is automatically generated in tons of CO2 (tCO2).
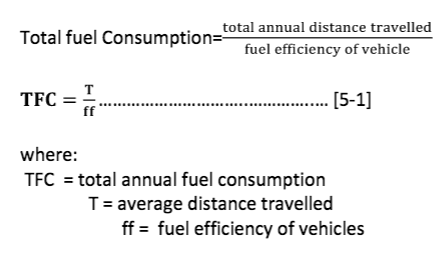
Where the record of fuel purchase is not available, the total litres of annual fuel consumption can be calculated as a product of the total annual distance travelled and the fuel efficiency of the vehicle type, as given below:
The calculation of total fuel consumption was modified based on the formula adopted for the Greenhouse Gas Emissions Inventory in Hobart and William Smith Colleges (Clayton, M and Thompson, M. 2008). The standard emissions factors for gasoline is given as 2.3 kilograms of Carbon dioxide equivalent (kCO2) while the standard emissions factors for Diesel oil is given as 2.7 kilograms of Carbon dioxide equivalent (kCO2) [42].
Perhaps of greatest interest are Columns I and L, which present the CO2 contribution of each element within the two service sectors to the overall total carbon emission. Note that these values can be observed and compared at a glance, greatly facilitating the challenge of making informed decisions.
Observations about MUCET’s energy-use data
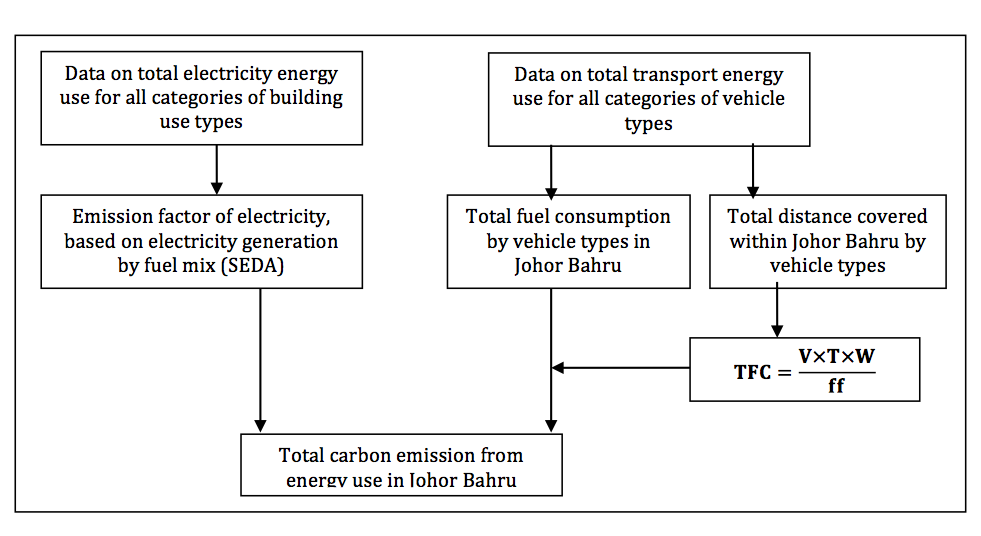
Some data-related caveats are in order. The major sources of data for energy use and carbon emission Johor Bahru were meter readings of total purchased electricity for all building categories and use types, as well as data from fuel consumption for the total transport energy use (or the total distance covered within Johor Bahru by vehicle types), as shown in Figure 8:
The data required for testing the tool were not available from a primary source, therefore, the study relies on secondary sources of data, whose reliability could not be ascertained. Similarly, it was not possible to obtain data on annual fuel consumption for energy use for all categories of vehicles, because such records are not kept by vehicle owners. Nor was it possible to obtain accurate meter reading for electricity consumption by categories of use in Johor Bahru.
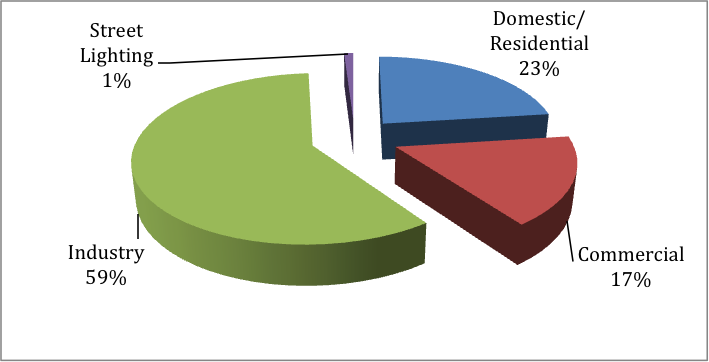
For the purpose of this study, data from the load growth scenario for Iskandar Malaysia (Table 1) and the Total number of registered vehicles by type (Table 2) were used to test the tool. It was noted that the highest 59% of carbon emission comes from the industrial sector while the street lighting emits about only 1% and residential and commercial sectors have 23% and 17% respectively (Figure 9). Therefore, emission reduction policy focused on the industrial sector could reduce overall carbon emission in Johor Bahru.
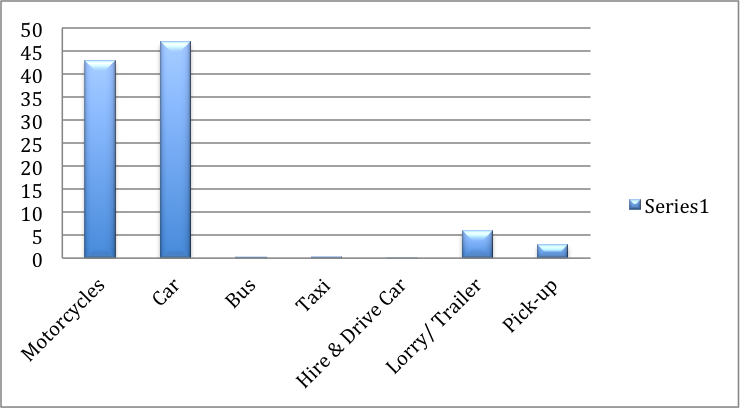
The percentage of carbon emission from the transport sector in Johor Bahru is presented in Figure 10. Cars and motorcycles produced the highest levels of CO2 emissions—of 47 percent and 43 percent, respectively—while the buses, taxis, and hired/drive vehicles registered in the city produce only negligible emissions. Therefore, policies that target cars and motorcyles are most likely to be effective in achieving significant reductions carbon emissions.
To summarize: MUCET offers direct measurement of CO2 emissions from the combustion of fossil fuel use in electricity and transport, which as previously noted together constitute about 78 percent of total emission in cities (World Watch Institute, 2008). MUCET can also measure, monitor, and simulate policy outcomes by inserting the values of electricity or fuel consumption for the category of use or service demand in the appropriate columns and rows of types of energy use. Other service demands that require the combination of fuel and electricity energy use, such as agriculture and water, can also be calculated in a similar manner, showing total percentages as well as their percentages of the total emission.
Conclusion
Nations worldwide are counting on economic growth in their cities for wealth generation, and for corresponding improvements in their standards of living (World Bank 2010). But this development strategy contains an inherent challenge: as long as economic growth and wealth generation rely on fossil-fuel energy sources, carbon emissions will continue to rise, with serious environmental implications for the city, the nation, and the planet. Low-carbon development could counter this trend, but that will depend on better management of cities’ emissions, particularly from energy use sources that contribute significantly to cities emission.
This paper focuses on Johor Bahru as an illustrative case study. Promoting low-carbon development through carbon emission reduction measures in Johor Bahru will require a movement toward low-carbon power generation to achieve its goals. This, in turn, will require the use of renewable energy sources in transport and power generation, and the provision of incentives for specific sector policy reforms in urban transport policies.
But unless there is an efficient measuring system and the mobilization of stakeholders through strengthened partnerships towards a low-carbon future, effective management will be difficult. All stakeholders must understand what is being measured, and why. Building on that base of shared knowledge, government officials can then make appropriate investments in reduced consumption and low-carbon power generation for both transport and electrical energy.
For example: officials in Johor Bahru could focus on improving the public transport sectors, perhaps by retrofitting the existing stock of public buses to make that transport option more attractive, and converting those vehicles to compressed natural gas. Lower energy intensities are experienced in countries with higher energy prices; therefore, systems such as Integrated Urban Road Pricing may prove useful in Johor Bahru. Promoting low–interest loans that steer consumers toward the purchase of hybrid cars, investing in the pedestrian and bicycle infrastructures, and similar best-practice strategies also could help reduce emissions in the city.
On the power-generation side, low-carbon development in Johor Bahru will likely involve reduced the fossil fuel components of the electricity-generation fuel mix. For example, embracing biogas and biomass energy sources seems particularly promising, since the country’s many palm oil plantations produce biomass in very large quantities. None of this will happen easily, especially in the absence of the political will to adopt the policies that are essential to driving change. That determination must originate in the mindset of individual consumers in Johor Bahru—consumers who come appreciate the link between consumption pattern and environmental impact. That mindset, in turn, can only grow out of the measurement and monitoring of agreed-upon variables of the energy system.
A key step to this could be achieved through a relatively simple method of carbon inventory, such as that as offered by MUCET. MUCET is user-friendly. It is less complicated and cumbersome than its counterparts. The challenge of data collection, especially for transport, can be overcome by encouraging transport owners to keep logbooks that record vehicular movements throughout the year for submission in exchange for some incentives or reduction in vehicle license fees. Finally, the tool could be improved further. For example, vehicle owners could send information online when the vehicle is refueled, thereby updating key data continuously.
To summarize: To help promote a “green economy,” the government of Johor Bahru should focus on the reduction of CO2 emissions. One way it can do so is by monitoring carbon emissions in the transport and electricity-generation sectors, which together account for much of the city’s total CO2 emissions. Adopting and using a relatively simple monitoring tool like MUCET can make this challenge far more manageable.
Acknowledgements
This research was sponsored by the Government of Malaysia through the Ministry of Higher Education, Malaysia. The researcher is very grateful and honored for the privilege to participate in the Malaysia Sustainable Cities Program 2015/2016 collaboration between Massachusetts Institute of Technology, MIT, USA, and Universiti Teknologi Malaysia, UTM Malaysia.
References
[1] STERN N. 2009. Low-carbon growth: the only sustainable way to overcome world poverty. THE WORLD BANK. IBRD.IDA http://blogs.worldbank.org/climatechange/low-carbon-growth-only-sustaina.... Accessed in October,2015.
[2] Nakhooda, S. 2008. Catalyzing Low Carbon Development? The Clean Technology Fund. WRI Working Paper. World Resources Institute, Washington DC. Online http://www.wri.org/iffe accessed 2015.www.epa.gov/otaq/climate.htm. accessed 2009
[3] IPCC, (2007). “Climate Change 2007: The Physical Science Basis. Summary for Policymakers.” Fourth Assessment Report of the Intergovernmental Panel on Climate Change. Feb. 2007.
[4] Intergovernmental Panel on Climate Change (IPCC). 2014. Climate change 2014: Synthesis report. Retrieved from http://www.ipcc.ch
[5] (Urban, 2010)
[6] IUE. 2010. Study on Low Carbon Development and Green Jobs in China Institute for Urban and Environmental Studies (IUE), Academy of Social Sciences (CASS) & ILO office for China and Mongolia April 2010
[7] ZHENG Yan et al., 2010: Low Carbon Development and Green Jobs in China. Institute for Urban and Environmental Studies (IUE), Chinese Academy of Social Sciences (CASS). ILO office for China and Mongolia April 2010.
[8] Colenbrander S. Et al., 2015: Exploring the Economic Case for Early Investment in Climate Change Mitigation in Middle Income Countries: a case of Johor Bahru, Malaysia. Climate and Development. http://dx.doi.org.ezproxy.canberra.edu.au/10.1080/17565529.2015.1040367
[9] (Energy White Paper, 2003)
[10] OECD, IEA, 2010. Low Emission Development Strategies. OECD Publishing.
[11] Bulkeley , H. et al., 2009: Cities and Climate Change: The role of institutions, governance and urban planning. 5th World Bank Urban Research Symposium on Climate Change 28-30 June 2009, Marseille.
[12] The World Bank (2010): Cities and climate change: An Urgent Agenda. Urban Development Series Knowledge Papers. The International Bank for Reconstruction and Development/The World Bank,1818 H Street NW. Washington DC 20433
[13] (Eleventh Malaysia Plan 2016-2020 (2015)
[14] Low Carbon Society Blueprint for Iskandar Malaysia 2025 – Summary for Policymakers (2012)
[15] Ho, C.S., Chau L.W., Teh B.T., Matsuoka Y., Gomi K., Rohayu A., Nadzirah J., NurSyazwani S., Muhammad Akmal Hakim H. and Lv Y. (eds.) (2015) Low Carbon Society Action Plan for Johor Bahru 2025: Vibrant World Class Cosmopolis of the South. Johor Bahru: UTM-Low Carbon Asia Research Centre.
[16] Low-Carbon City 2025. SUSTAINABLE ISKANDAR MALAYSIA. Sponsored by vice chancellor council & Japan society for the promotion of science. The planning of urban energy and environmental systems (Group VII.) Universiti Teknologi Malaysia. Kyoto University. Okayama University. Ritsumeikan University.
[17] Jiusto, J. S. (2008). an indicator framework for assessing US state carbon emissions reduction effort (with baseline trends from 1990 to 2001), Energy Policy 36 (2008) 2234-2252
[18] Abdul-Azeez, I.A. (2012) The Development and Application of Malaysian University Carbon Emission Tool (MUCET)towards Creating Sustainable Campus. Ph.D. Thesis, UTM, Johor.
[19] Su et al., 2013: Evaluation of a Low-Carbon City: Method and Application. ENTROPY 2013, VOL.15, www.mdpi.com/journal/entropy. accessed may, 2016.
[20] Urban, F. and Nordensvard, J. (Ed.). 2013. Low-Carbon Development key issues in environmental sustainability. Routledge taylor & Francis Group London and New York.
[21] (Van Vuuren et al., 2012)
[22] Worldwatch Institute 2008 Report, Making Better Energy Choices, www.worldwatch.org
[23] Caves J., Leano M., Lee J., Tupper A., (2007). Leaving Tracks: Measuring the Carbon Footprint of Rice University Students: Carbon Footprint Group, Spring 2007
[24] Sathiendrakumar, R. (2003) Greenhouse emission reduction and sustainable development International Journal of Social Economics Vol. 30 No. 12, 2003 pp. 1233-1248
[25] (Bloomfield and Yadoo, 2013)
[26] Tony Blair 2003: ENERGY WHITE PAPER our future- creating a low carbon economy.
[27] Jiusto, J. S. (2003). Spatial Indeterminacy and Power Sector Carbon Emissions Accounting. Ph.D. Thesis. Faculty of Clark University, Worcester, Massachusetts,
[28] Hardy, D. (2008) Cities that don't cost the earth Published by Jon Land for TCPA in Housing and also in Communities, Local Government Monday 2nd June 2008.
[29] Arrow K. J. (2007) Global Climate Change: A Challenge to Policy, ECOMNOMIC VOICE, The Berkeley Electronic Press, www.bepress.com/ev
[30] Pope, J., Annandale D., Morrison-Saunders 2004). Conceptualising Sustainability Assessment, Environmental Impact Assessment Review, Environmental Impact Assessment Review Vol. 24, pp 595– 616
[31] Sheng, P. and Ding L. (2015): Low-carbon development and carbon reduction in China . ISSN: 1756-5529 (Print) 1756-5537 (Online) Journal homepage: http://www.tandfonline.com.ezproxy.canberra.edu.au/loi/tcld20. Accessed online September 2015.
[32] United Nations Environment Programme, (UNEP) 2011. Towards a Green Economy: Pathways to Sustainable Development and Poverty Eradication
[33] Ho C.S and Matsuoka Y. 2013. The Low Carbon Society Blueprint for Iskandar-Malaysia 2025 – Summary for Policymakers. UTM-Low Carbon Asia Research Center. ISBN:978-967-11889-0-3
[34] Sustainable energy development authority (SEDA) 2015 http://www.seda.gov.my/?omaneg=00010100000001010101000100001000000000000...
[35] (IEA, 2015)
[36] Motor Trader 2013: Motor Trader Car News – 10 facts about Malaysia’s vehicle population posted on March 2, 2013, http://www.motortrader.com.my/news/10-facts-about-malaysias-vehicle-popu... accessed 2016 (http://www.motortrader.com.my/news/malaysia-s-vehicle-population/)
[37] "Climate Change." Http://unhabitat.org/urban-themes/climate-change/.UN HABITAT FOR A BETTER URBAN FUTURE, n.d. Web. 18 May 2016.
[38] Pepple, K. D. 2009. Analysis of Mobile Emissions Attributable to the University of Houston for The Development Of Strategic Sustainability Goals. Ph.D. Thesis. University of Houston
[39] (Gomi et al. 2010)
[40] Cheng B. Peng W. (2016). The analysis of CO2 emission reduction using an ExSS model of Guangdong province in China. International Journal of Sustainable Energy. Volume 35, Issue 8, 2016. Accessed May, 2016. http://www.tandfonline.com.ezproxy.canberra.edu.au/doi/abs/10.1080/14786451.2014.950964?journalC...
[41] Abdul-Azeez, I.A. and Ho, C.S. (2015) Realizing Low Carbon Emission in the University Campus towardsEnergy Sustainability. Open Journal of Energy Efficiency, 4, 15-27. http://dx.doi.org.ezproxy.canberra.edu.au/10.4236/ojee.2015.42002 U.S. Environmental Protection Agency (2006) Greenhouse Gas Emissions from the U.S. Transportation Sector, 1990-2003.Washington, DC.
Notes
i “A Roadmap Towards Low Carbon Iskandar Malaysia.” UTM—Low carbon Asia Research Center 2013. https://www.nies.go.jp/media_kit/2014/4.5.pdf accessed 18.4.2016
ii Data for carbon emissions from combustion for 2014 and 2015 were not available.
iii See http://data.iea.org 2015.
iv “CO2 Emissions from Fuel Combustion,” OECD/IEA, Paris, 2015 http://wds.iea.org/wds/pdf/Worldco2_Documentation.pdf
v Johor Bahru City Council (Majlis Bandaraya Johor Bahru-MBJB) 2015
vi “CO2 Emissions from Fuel Combustion,” OECD/IEA, Paris, 2015
vii Road Transport Department (Jabatan Pengangkutan Jalan,JPJ), Johor Bahru, 2014
viii Low-Carbon City 2025. SUSTAINABLE ISKANDAR MALAYSIA.
ix Low-Carbon-Cities-Framework-and-Assessment-System.pdf http://esci-ksp.org/wp/wp-content/uploads/2012/04/
x Modified after Abdul-Azeez, 2012
xi Su et al., 2013
